
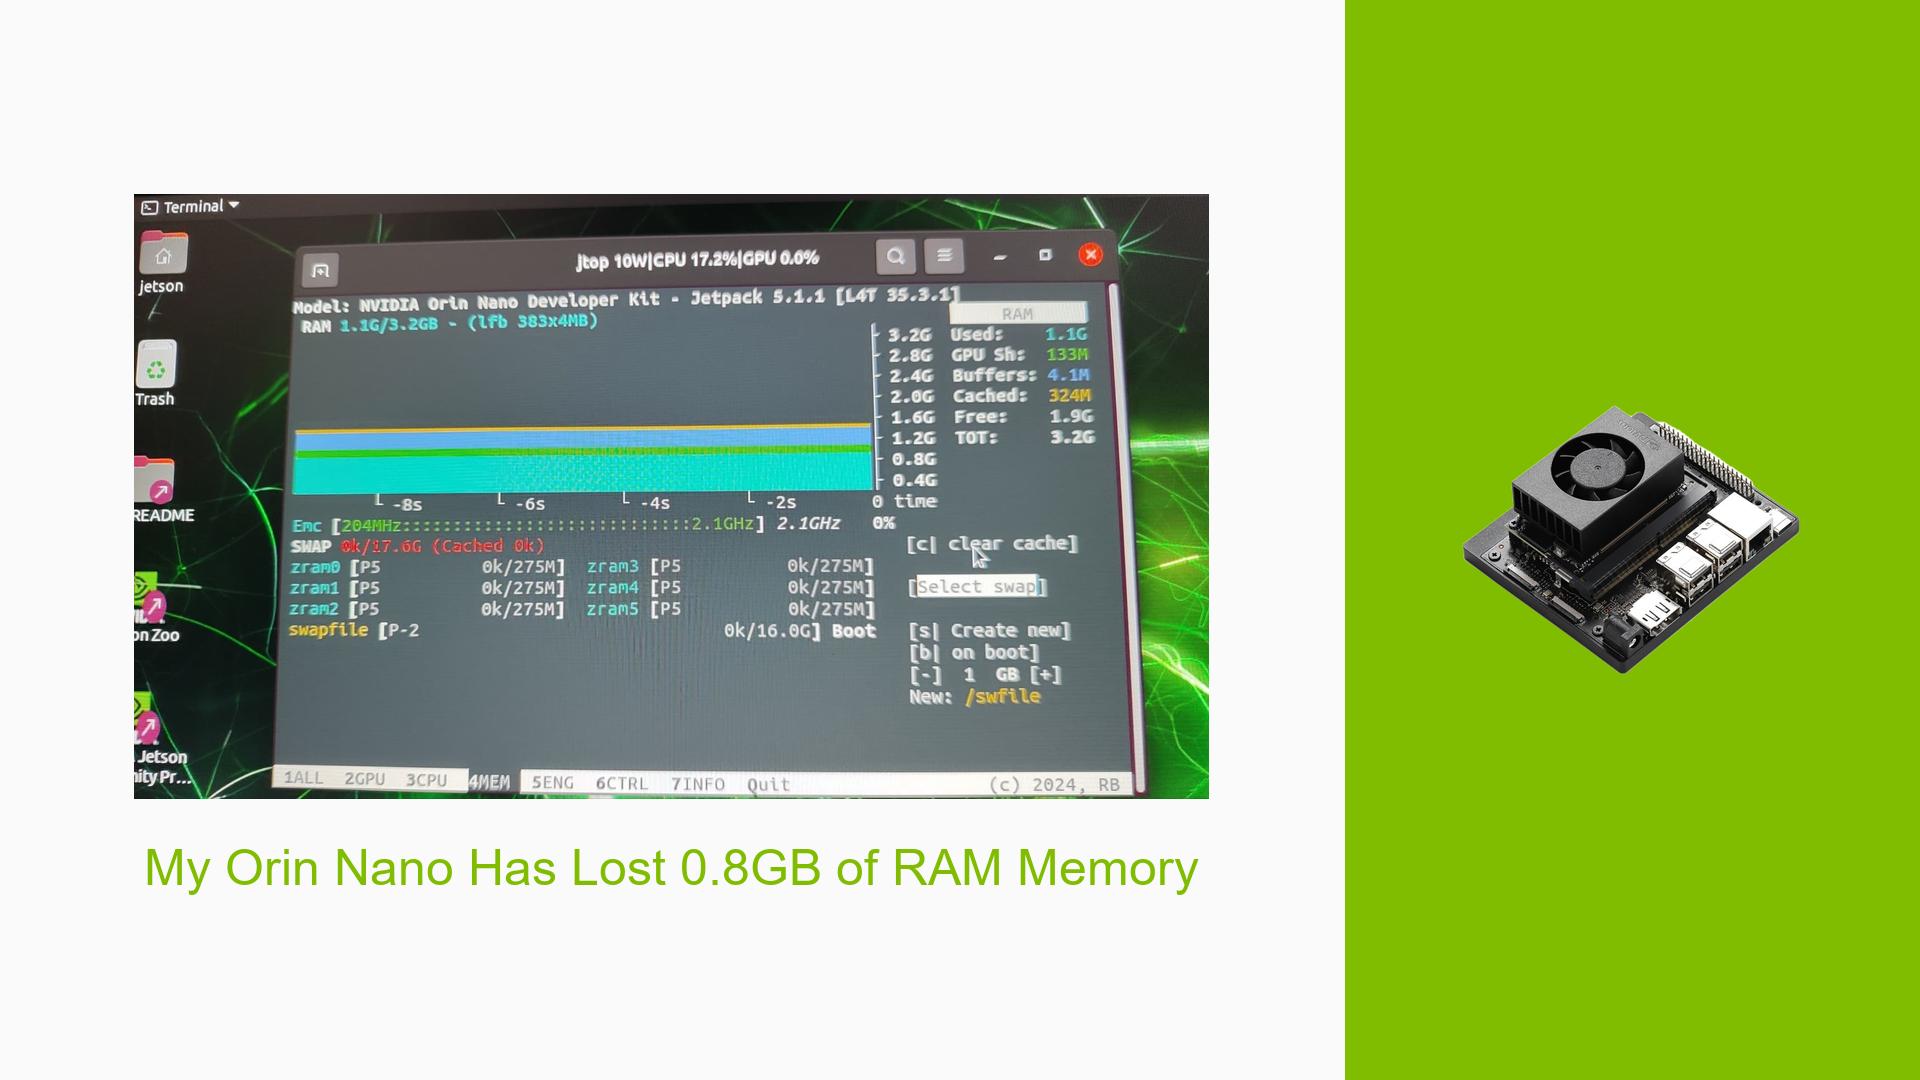
My Orin Nano Has Lost 0.8GB of RAM Memory
Issue Overview
Users of the Nvidia Jetson Orin Nano Dev board have reported a discrepancy in the total available RAM. Specifically, a user noted that upon executing the jtop command in the terminal, the displayed total memory for their 4GB Jetson Orin Nano was reduced to 3.2GB. This issue appears to arise during normal operation, particularly when users are checking system resources.
The symptoms include:
- A noticeable reduction in reported RAM from 4GB to 3.2GB.
- Confusion regarding whether this loss is permanent or if it can be recovered.
The issue is consistent across various Jetson Orin platforms, not limited to the Orin Nano, suggesting a broader concern among users. The impact on user experience can be significant, as it raises concerns about system performance and memory availability for applications.
Possible Causes
Several potential causes could explain the observed reduction in available RAM:
-
Reserved Memory: The system reserves a portion of RAM for essential functions and hardware management, which can lead to a lower available memory reading.
-
Unit Conversion Differences: Some tools may report memory using different base systems (base 10 vs. base 2), leading to apparent discrepancies in reported memory sizes.
-
Software Bugs or Conflicts: There may be bugs in the software or conflicts with other applications that affect how memory is reported.
-
Configuration Errors: Incorrect settings in the system configuration could potentially lead to improper reporting of memory.
Understanding these causes helps clarify that the issue may not indicate actual memory loss but rather differences in reporting or allocation.
Troubleshooting Steps, Solutions & Fixes
To address the reported issue of reduced RAM availability, users can follow these troubleshooting steps:
-
Check Reserved Memory:
- Use the command
jtoporfree -hto view memory usage and confirm how much is reserved by the system. - Note that some memory is typically reserved for hardware functions.
- Use the command
-
Verify Memory Reporting:
- Compare memory readings from different tools (e.g.,
htop,free,jtop) to identify discrepancies. - Understand that some tools may use different units for measurement (base 10 vs. base 2).
- Compare memory readings from different tools (e.g.,
-
Inspect System Configuration:
- Review system settings related to memory allocation and ensure they are configured correctly.
- Check for any firmware updates that might address memory reporting issues.
-
Test with Different Applications:
- Run various applications and monitor their memory usage to see if they reflect similar discrepancies.
- This can help isolate whether the issue is specific to certain software or more widespread.
-
Consult Documentation:
- Review Nvidia’s documentation for the Jetson Orin Nano regarding memory management and reserved resources.
- Check for any updates or patches that may affect memory reporting.
-
Best Practices:
- Regularly update your Jetson Orin Nano’s firmware and software to benefit from improvements and bug fixes.
- Monitor system performance regularly using tools like
jtoporhtopto stay informed about resource usage.
If multiple users have successfully identified reserved memory as a primary cause, this should be highlighted as a recommended approach for understanding the discrepancy in reported RAM.
Unresolved aspects of this issue may include specific cases where users continue to experience significant reductions in available RAM beyond expected reservations, warranting further investigation into potential hardware defects or deeper software issues.